src
Introduction
Installation
Grid Generation
Classification of Pylovo Grids
Visualisation
Contents
QGIS Visualisation
Plotting Networks
Plot Networks
Plot Network Data per PLZ
Plot Graphs for Classification
Futher Reading
src
Visualisation
Plotting Networks
Plot Graphs for Classification
View page source
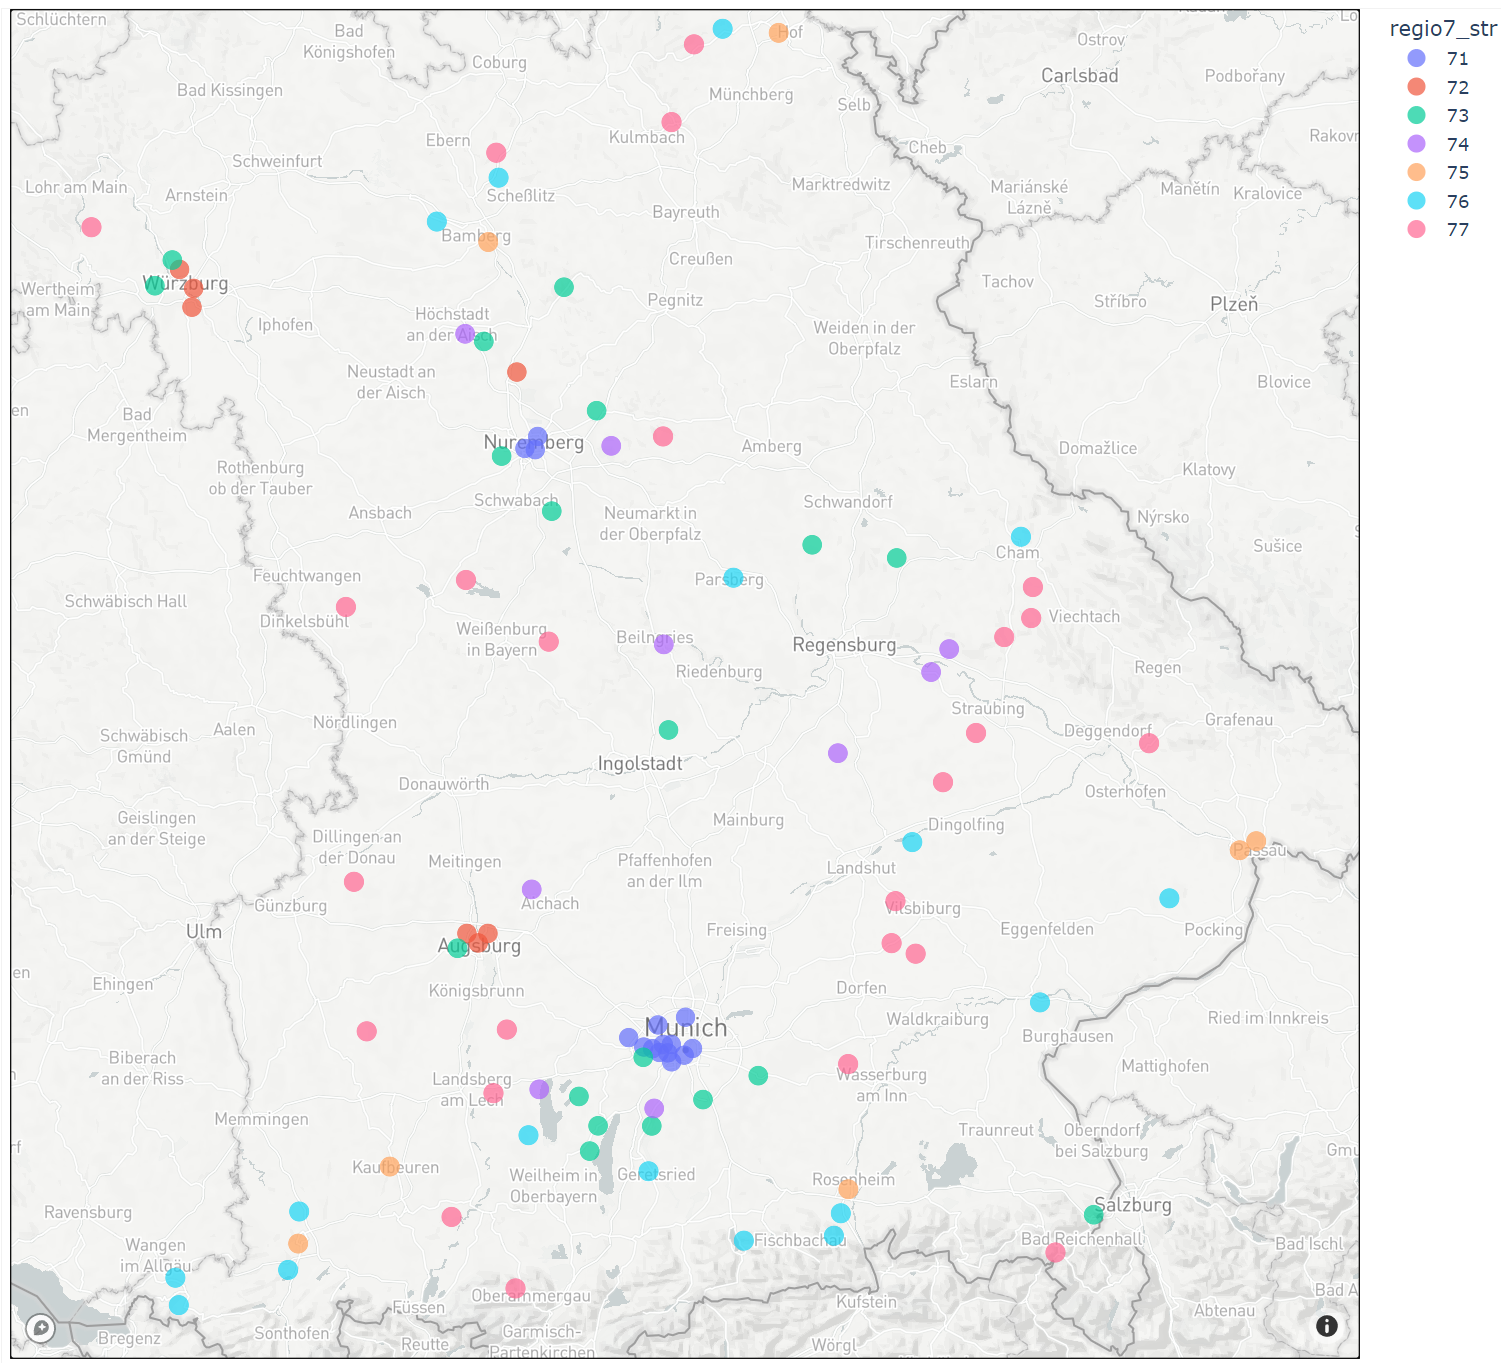
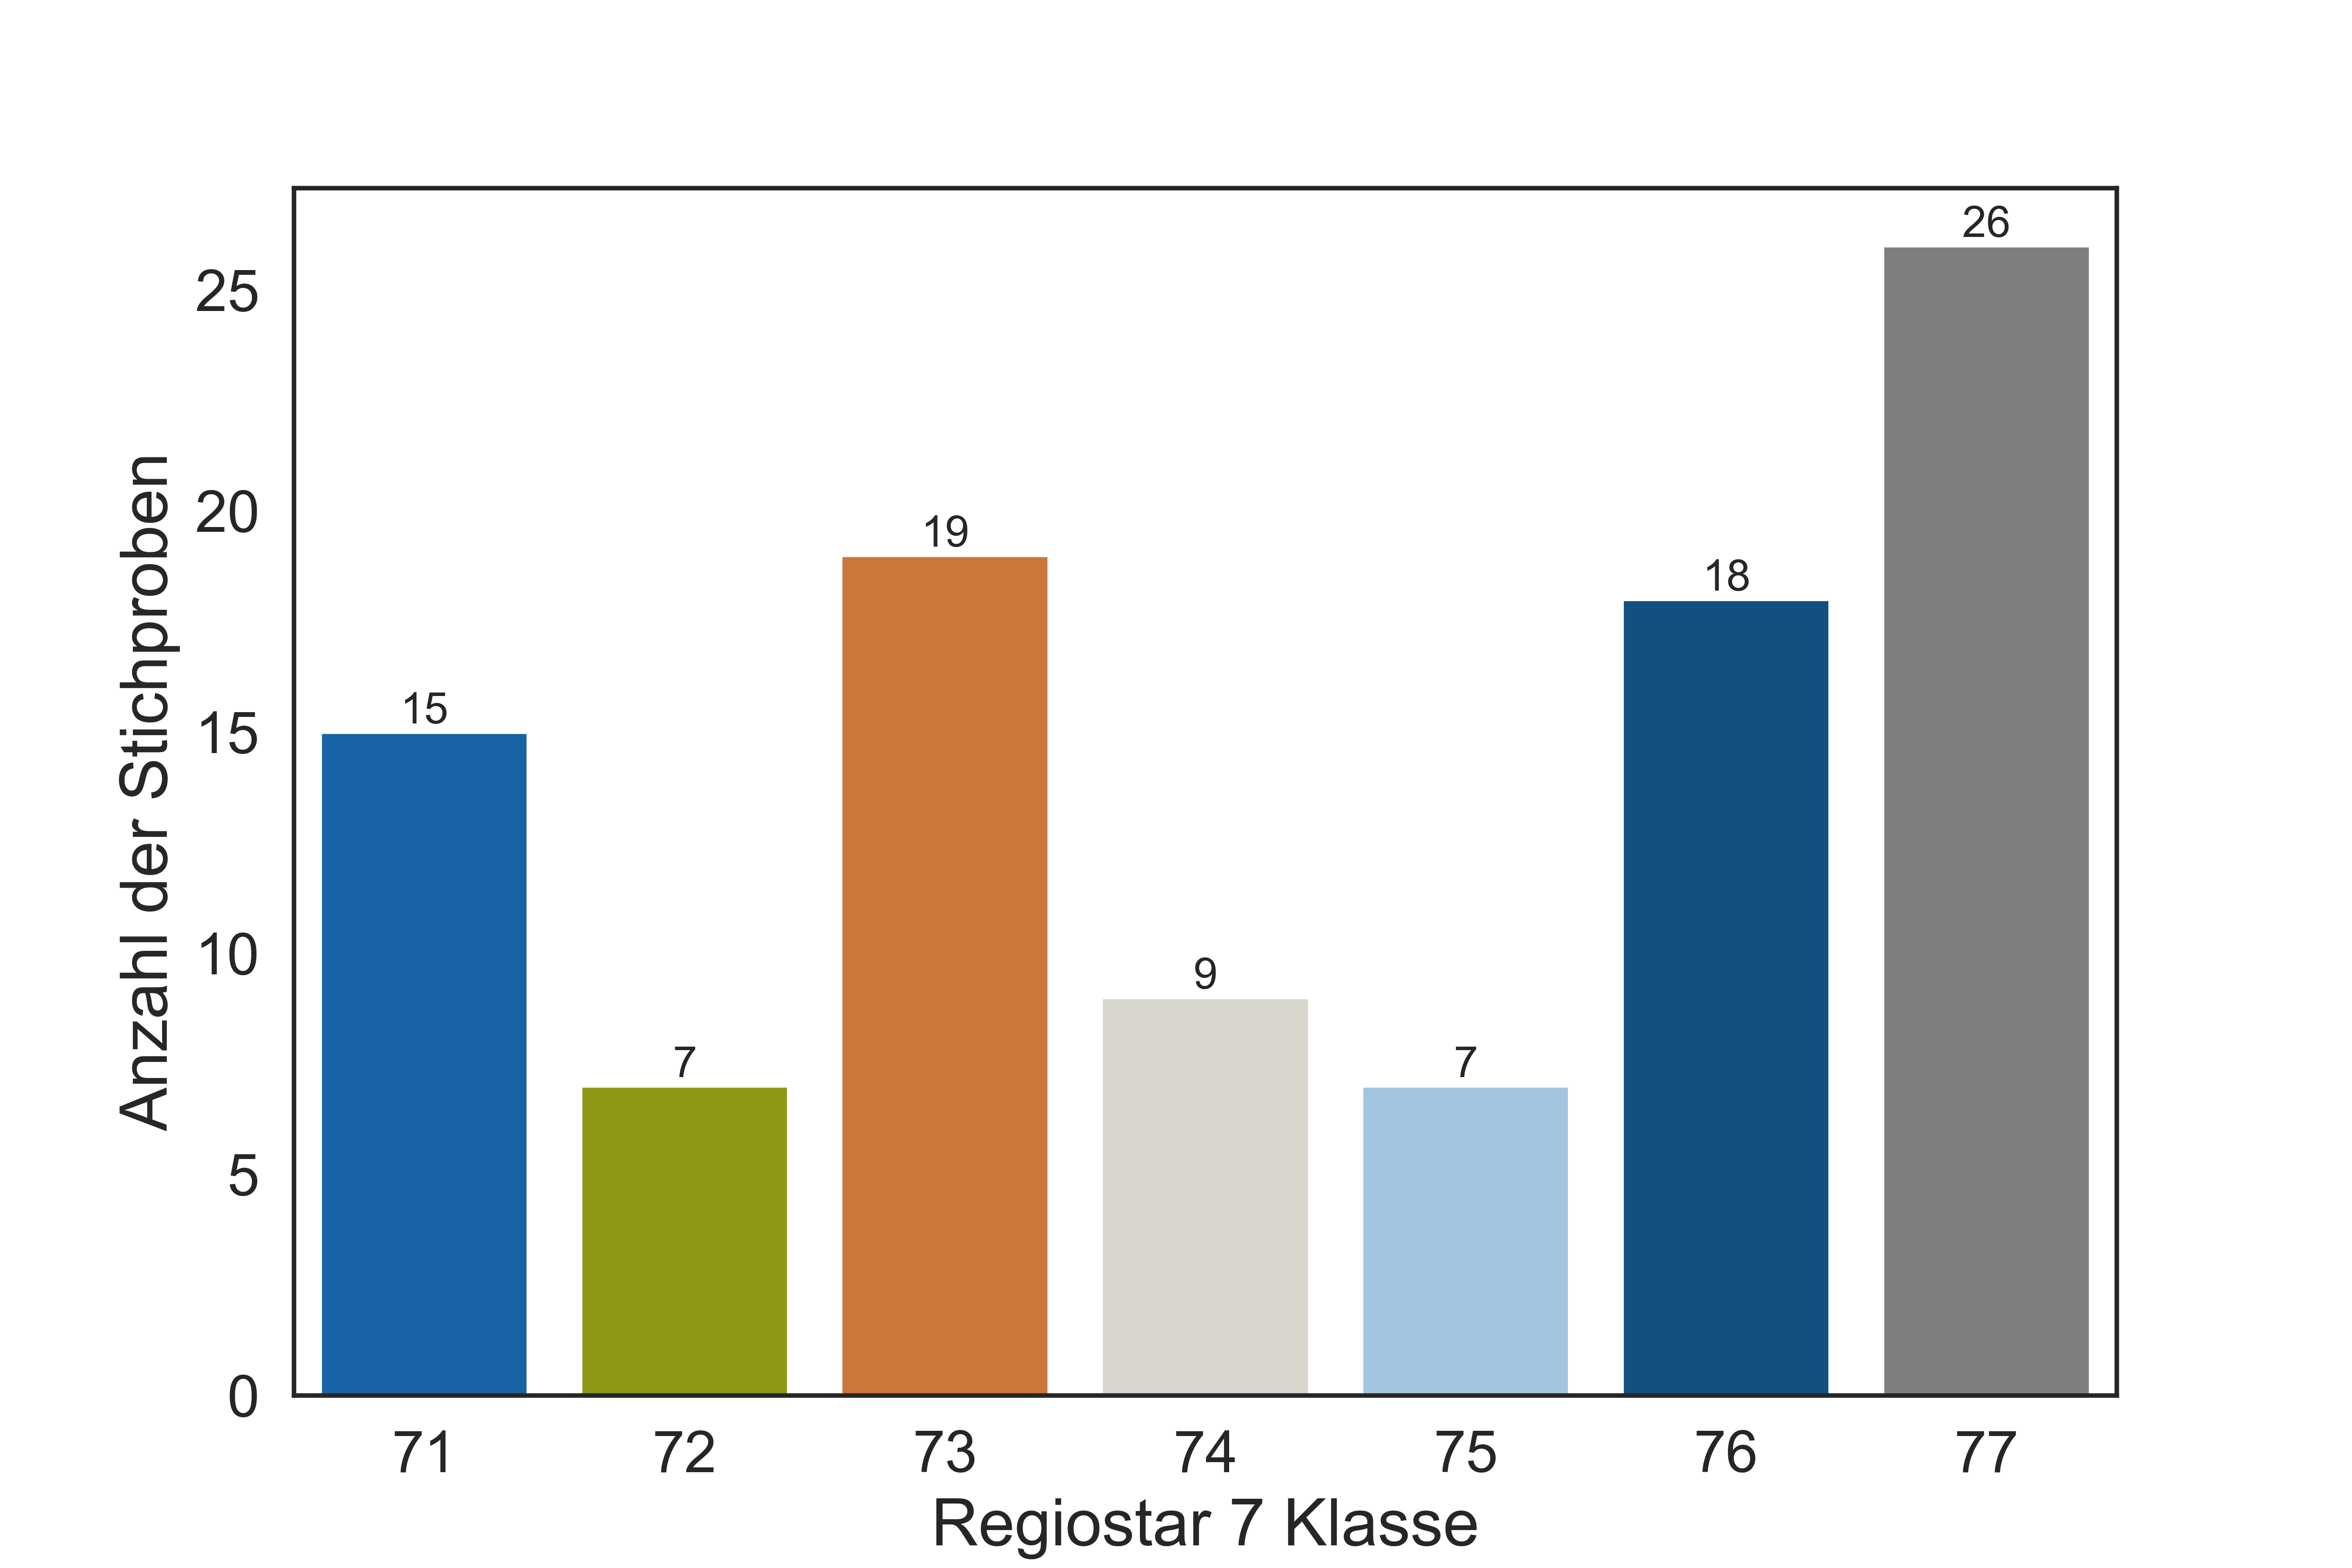
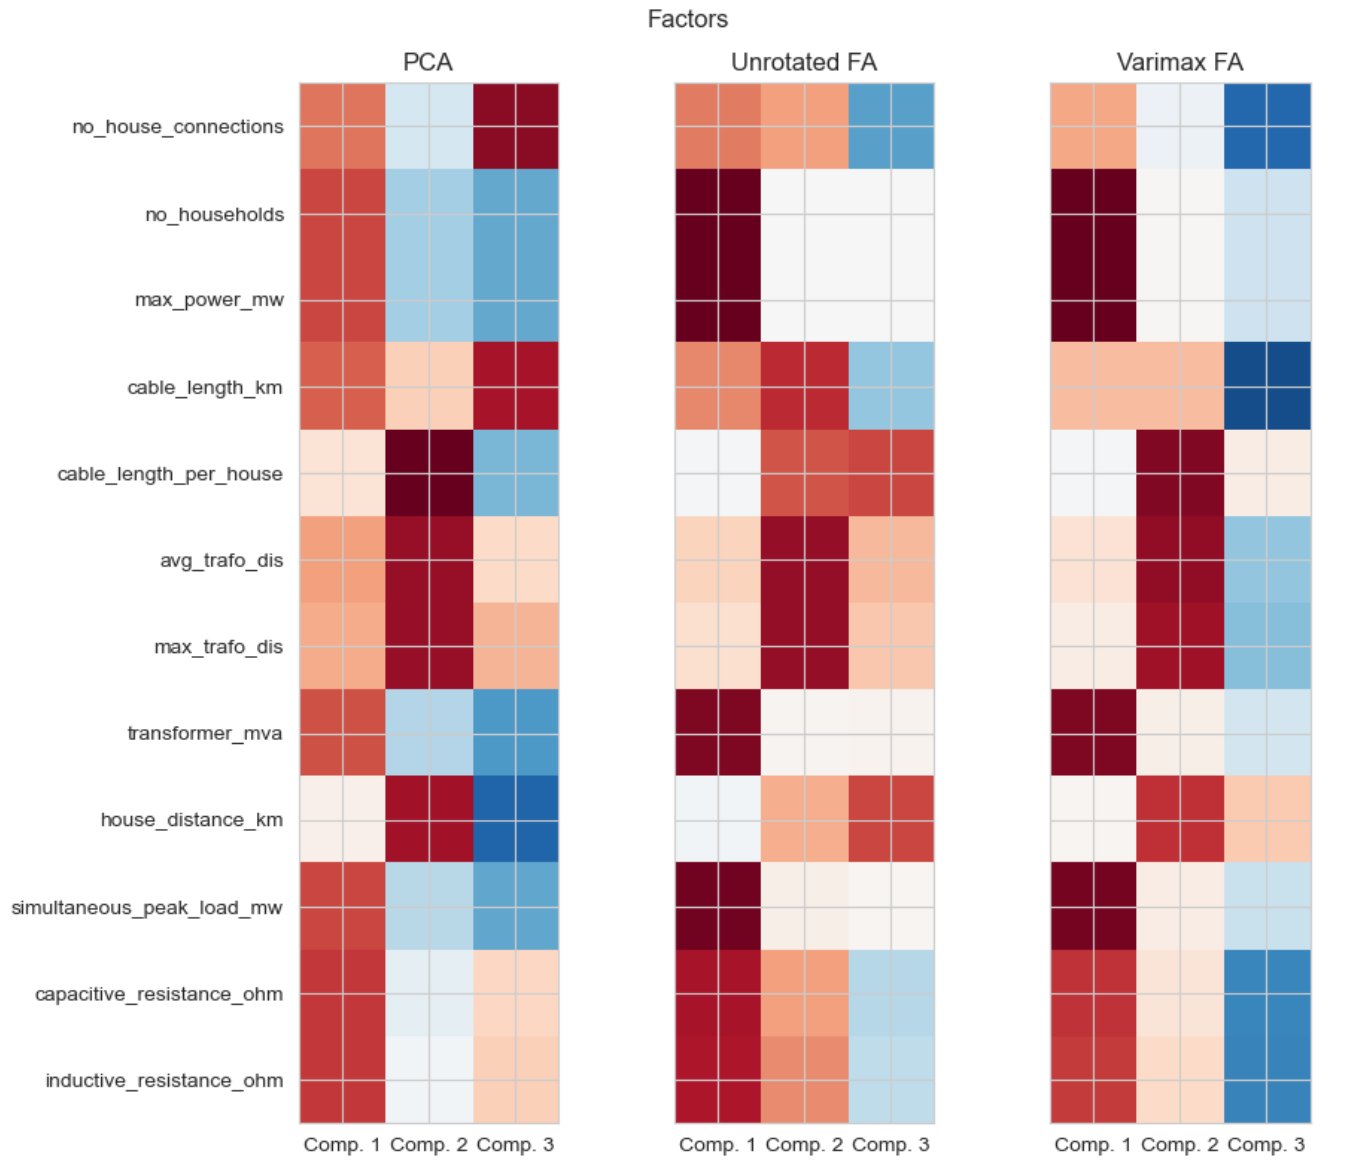
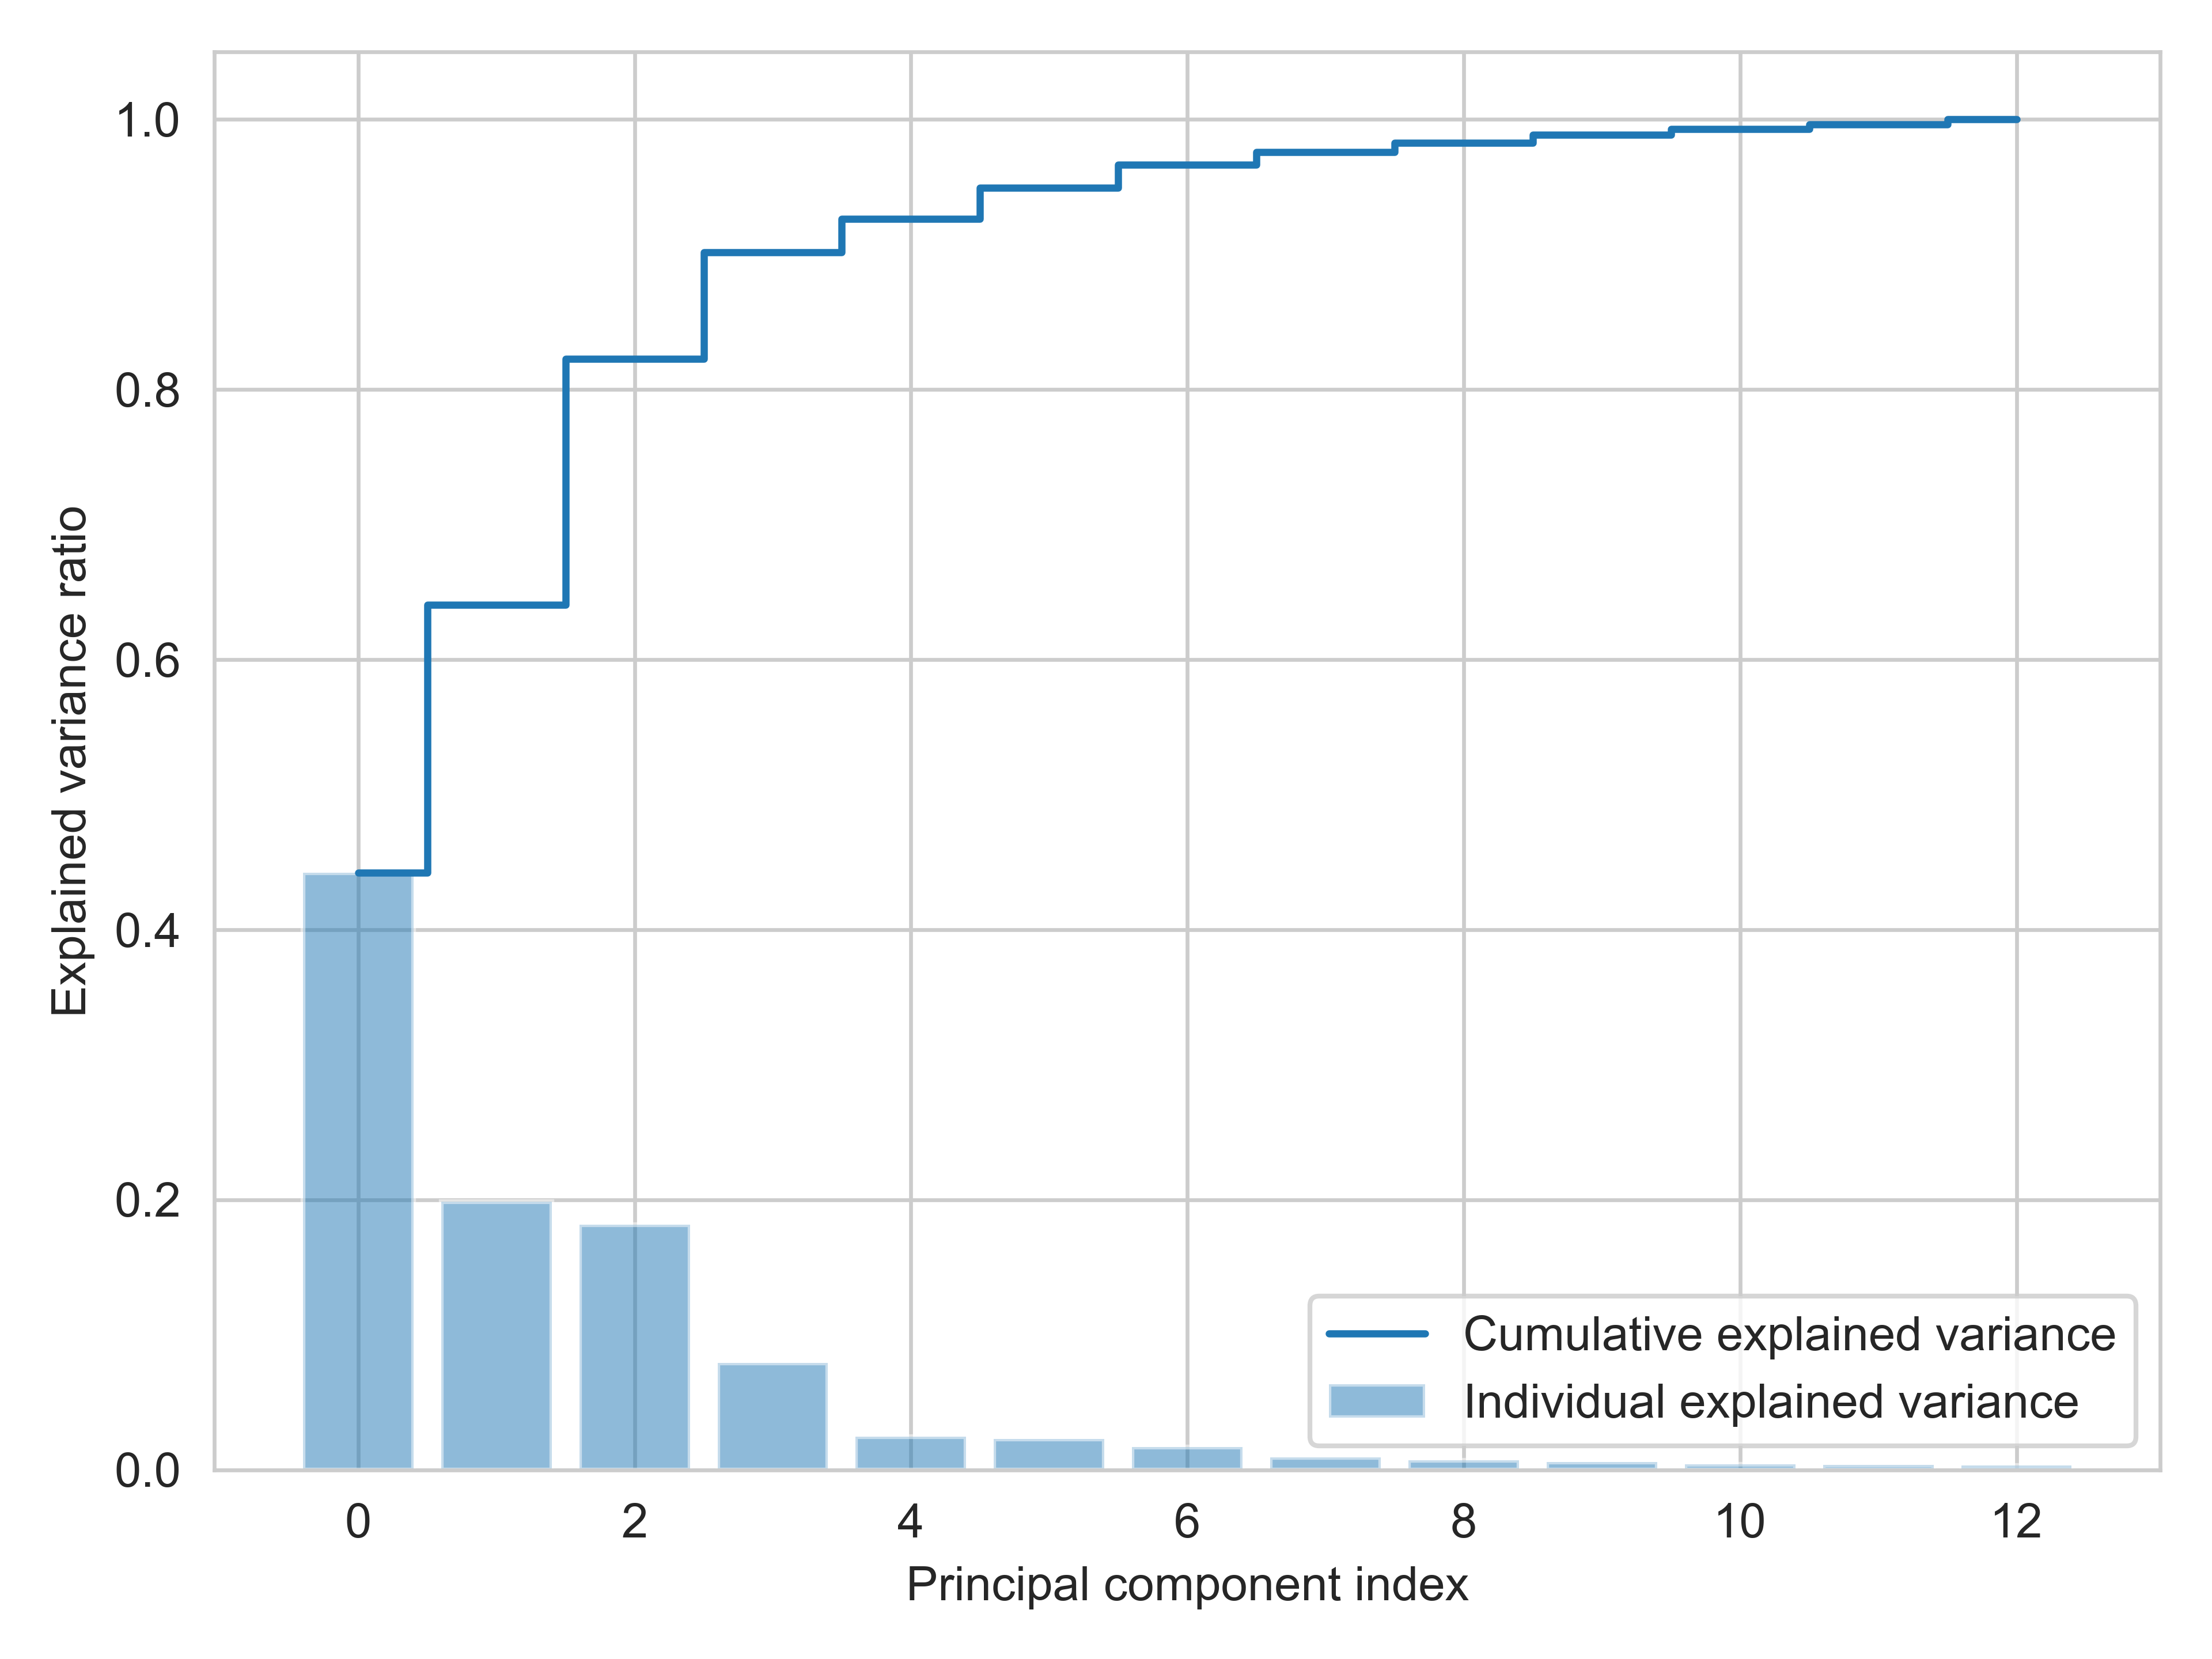
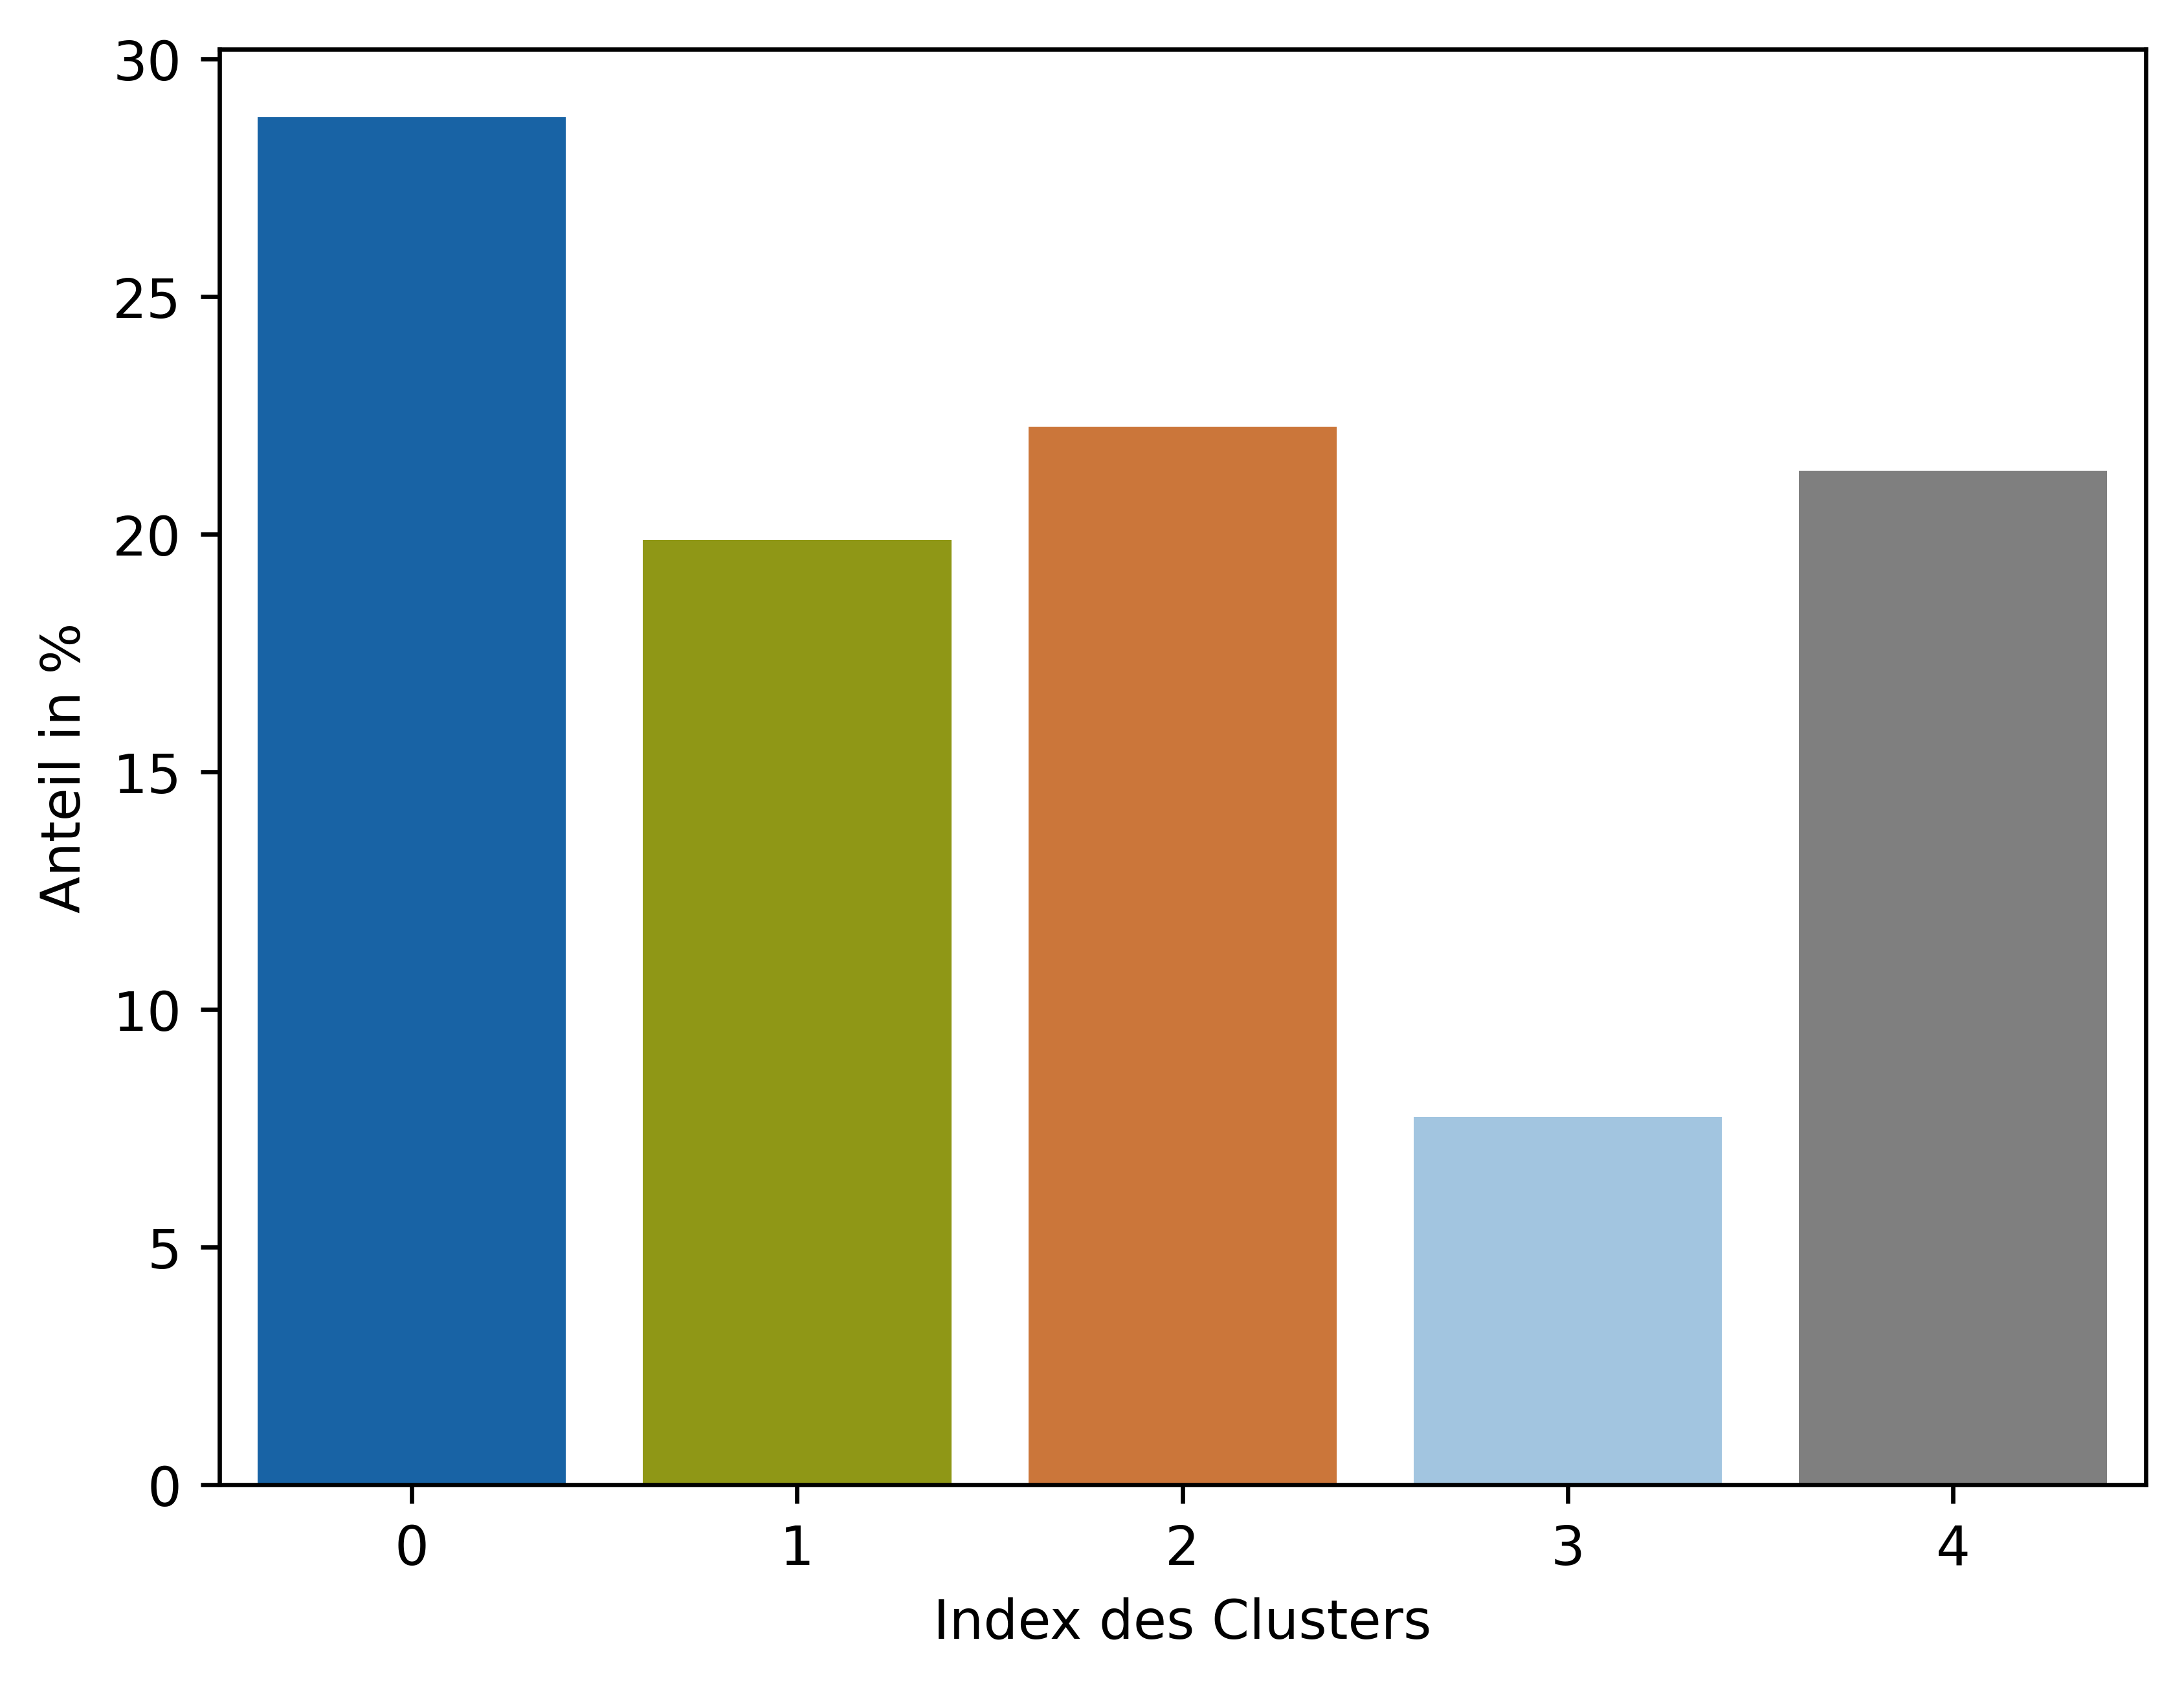
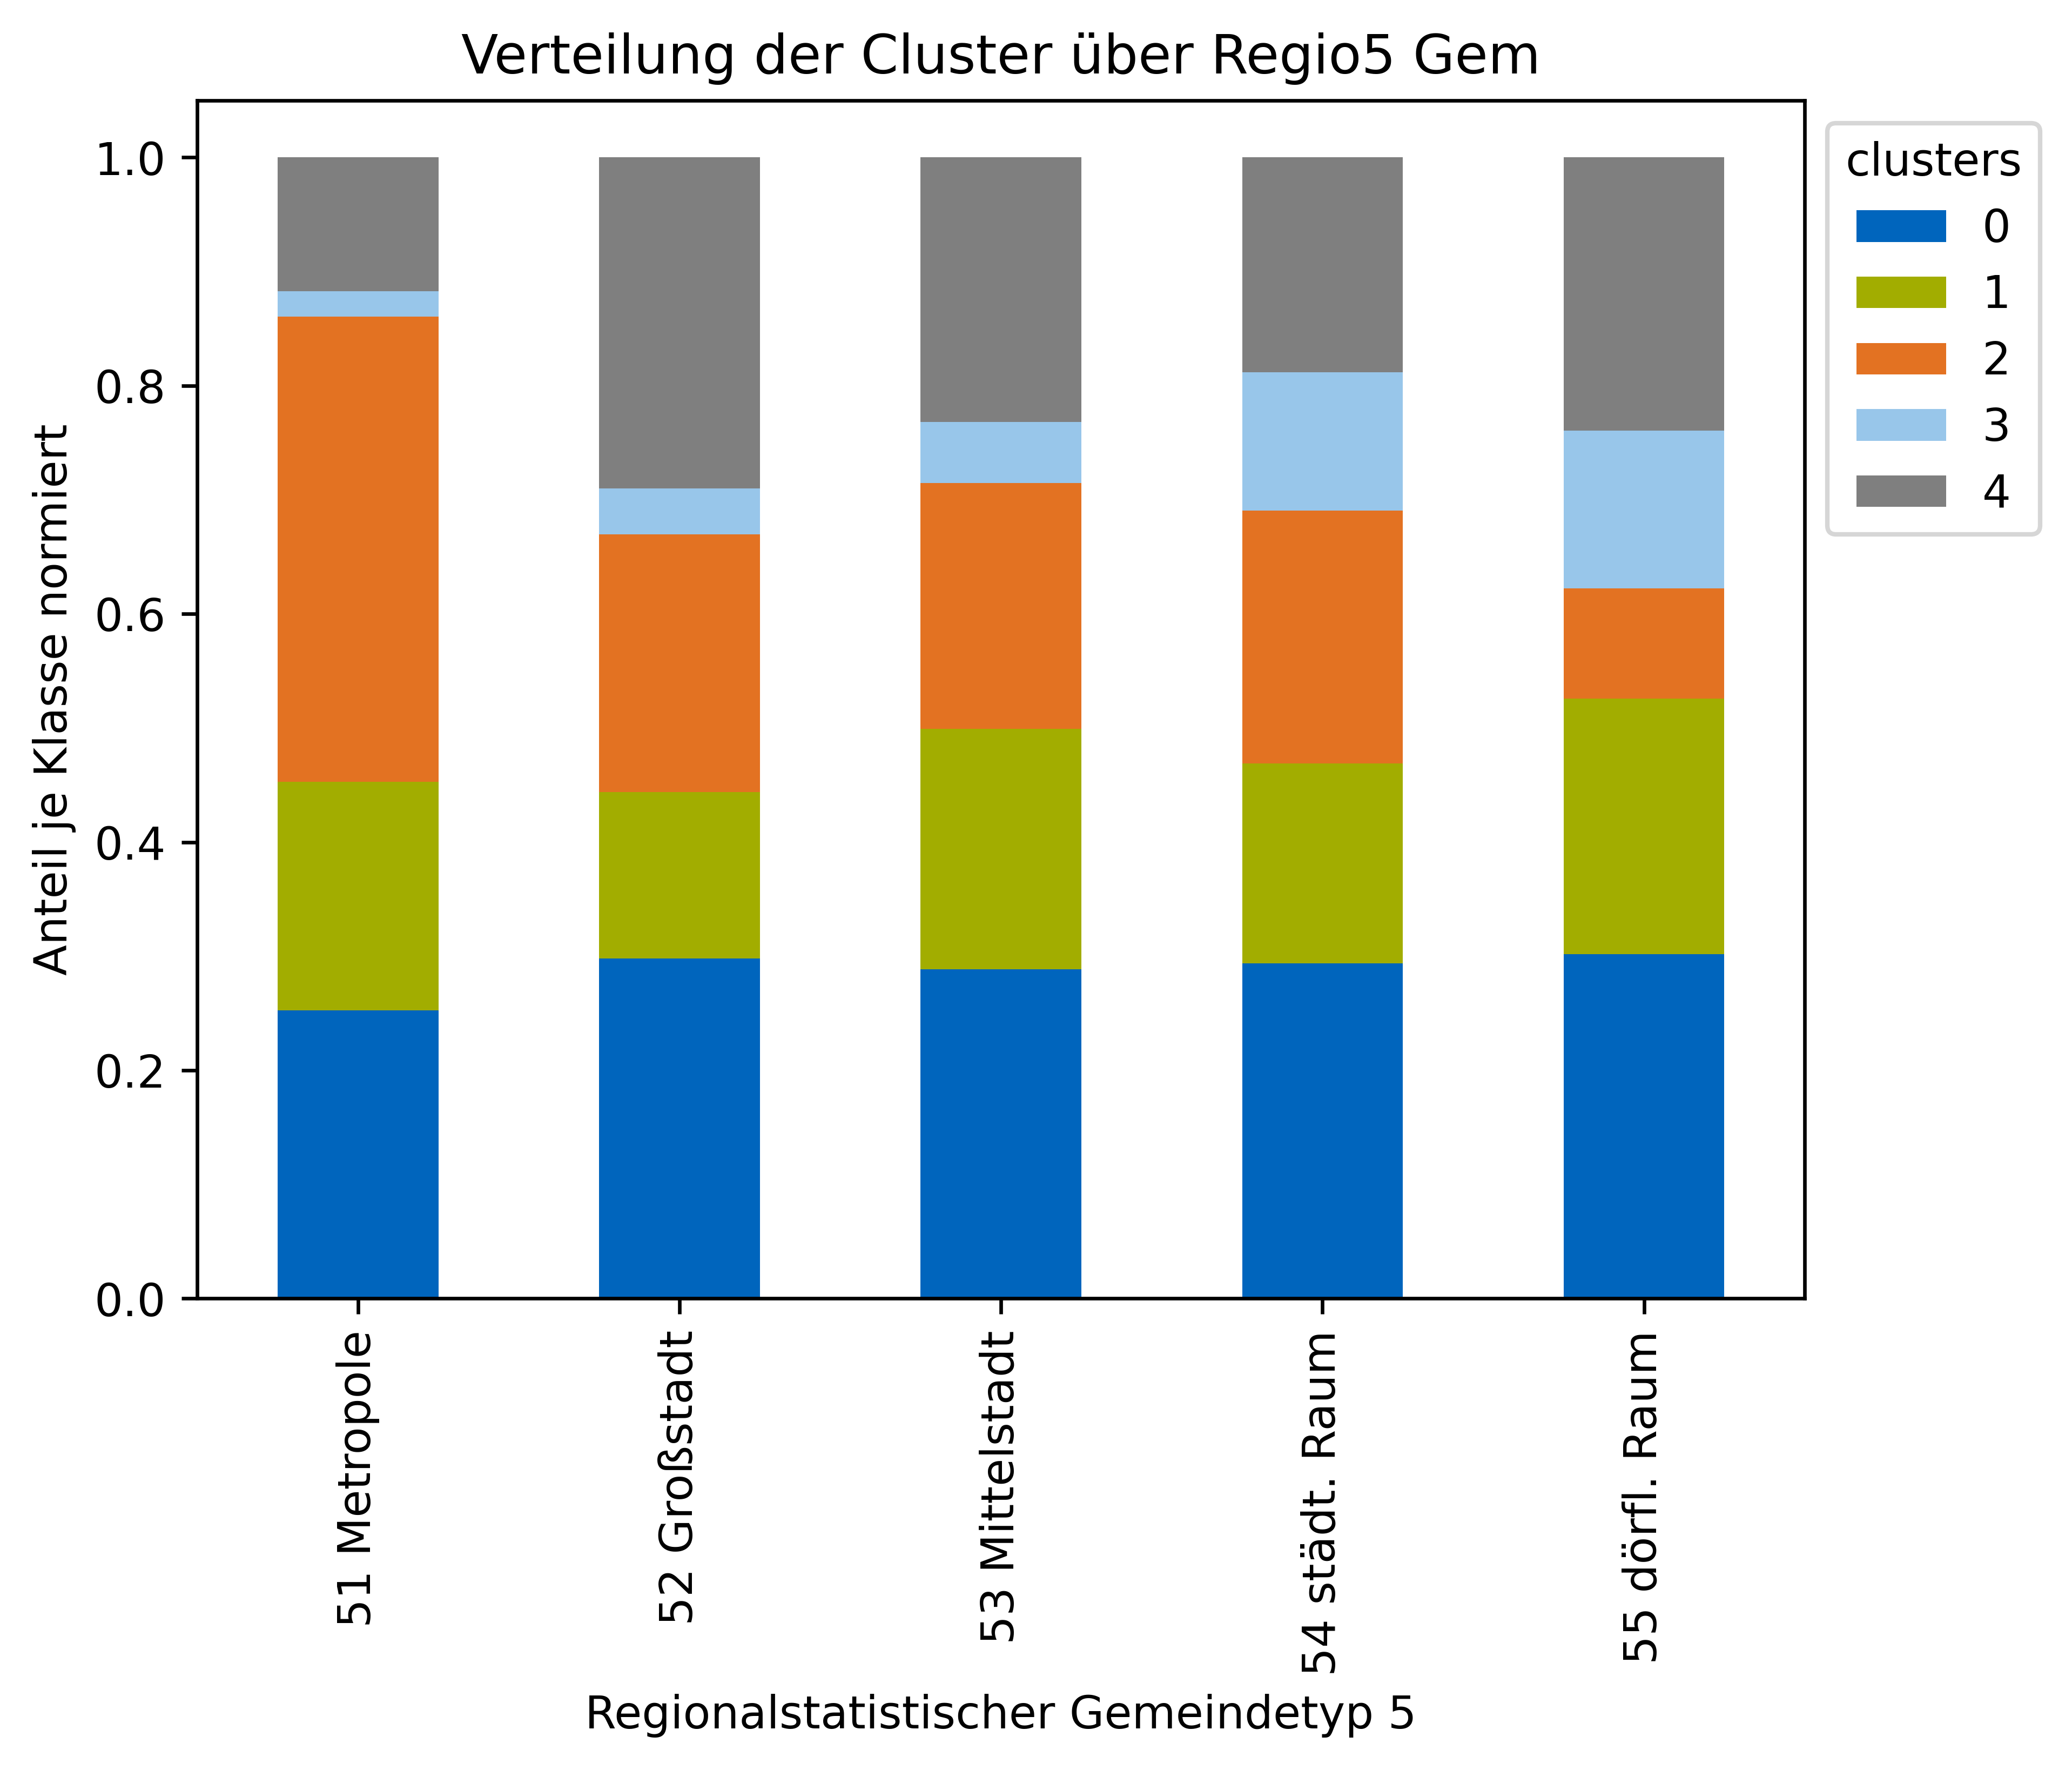
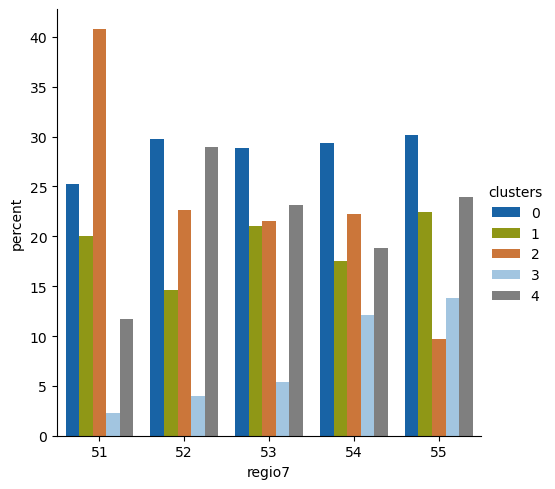
Plot Graphs for Classification
The plots to visualise results from the classification process are:
Sampling
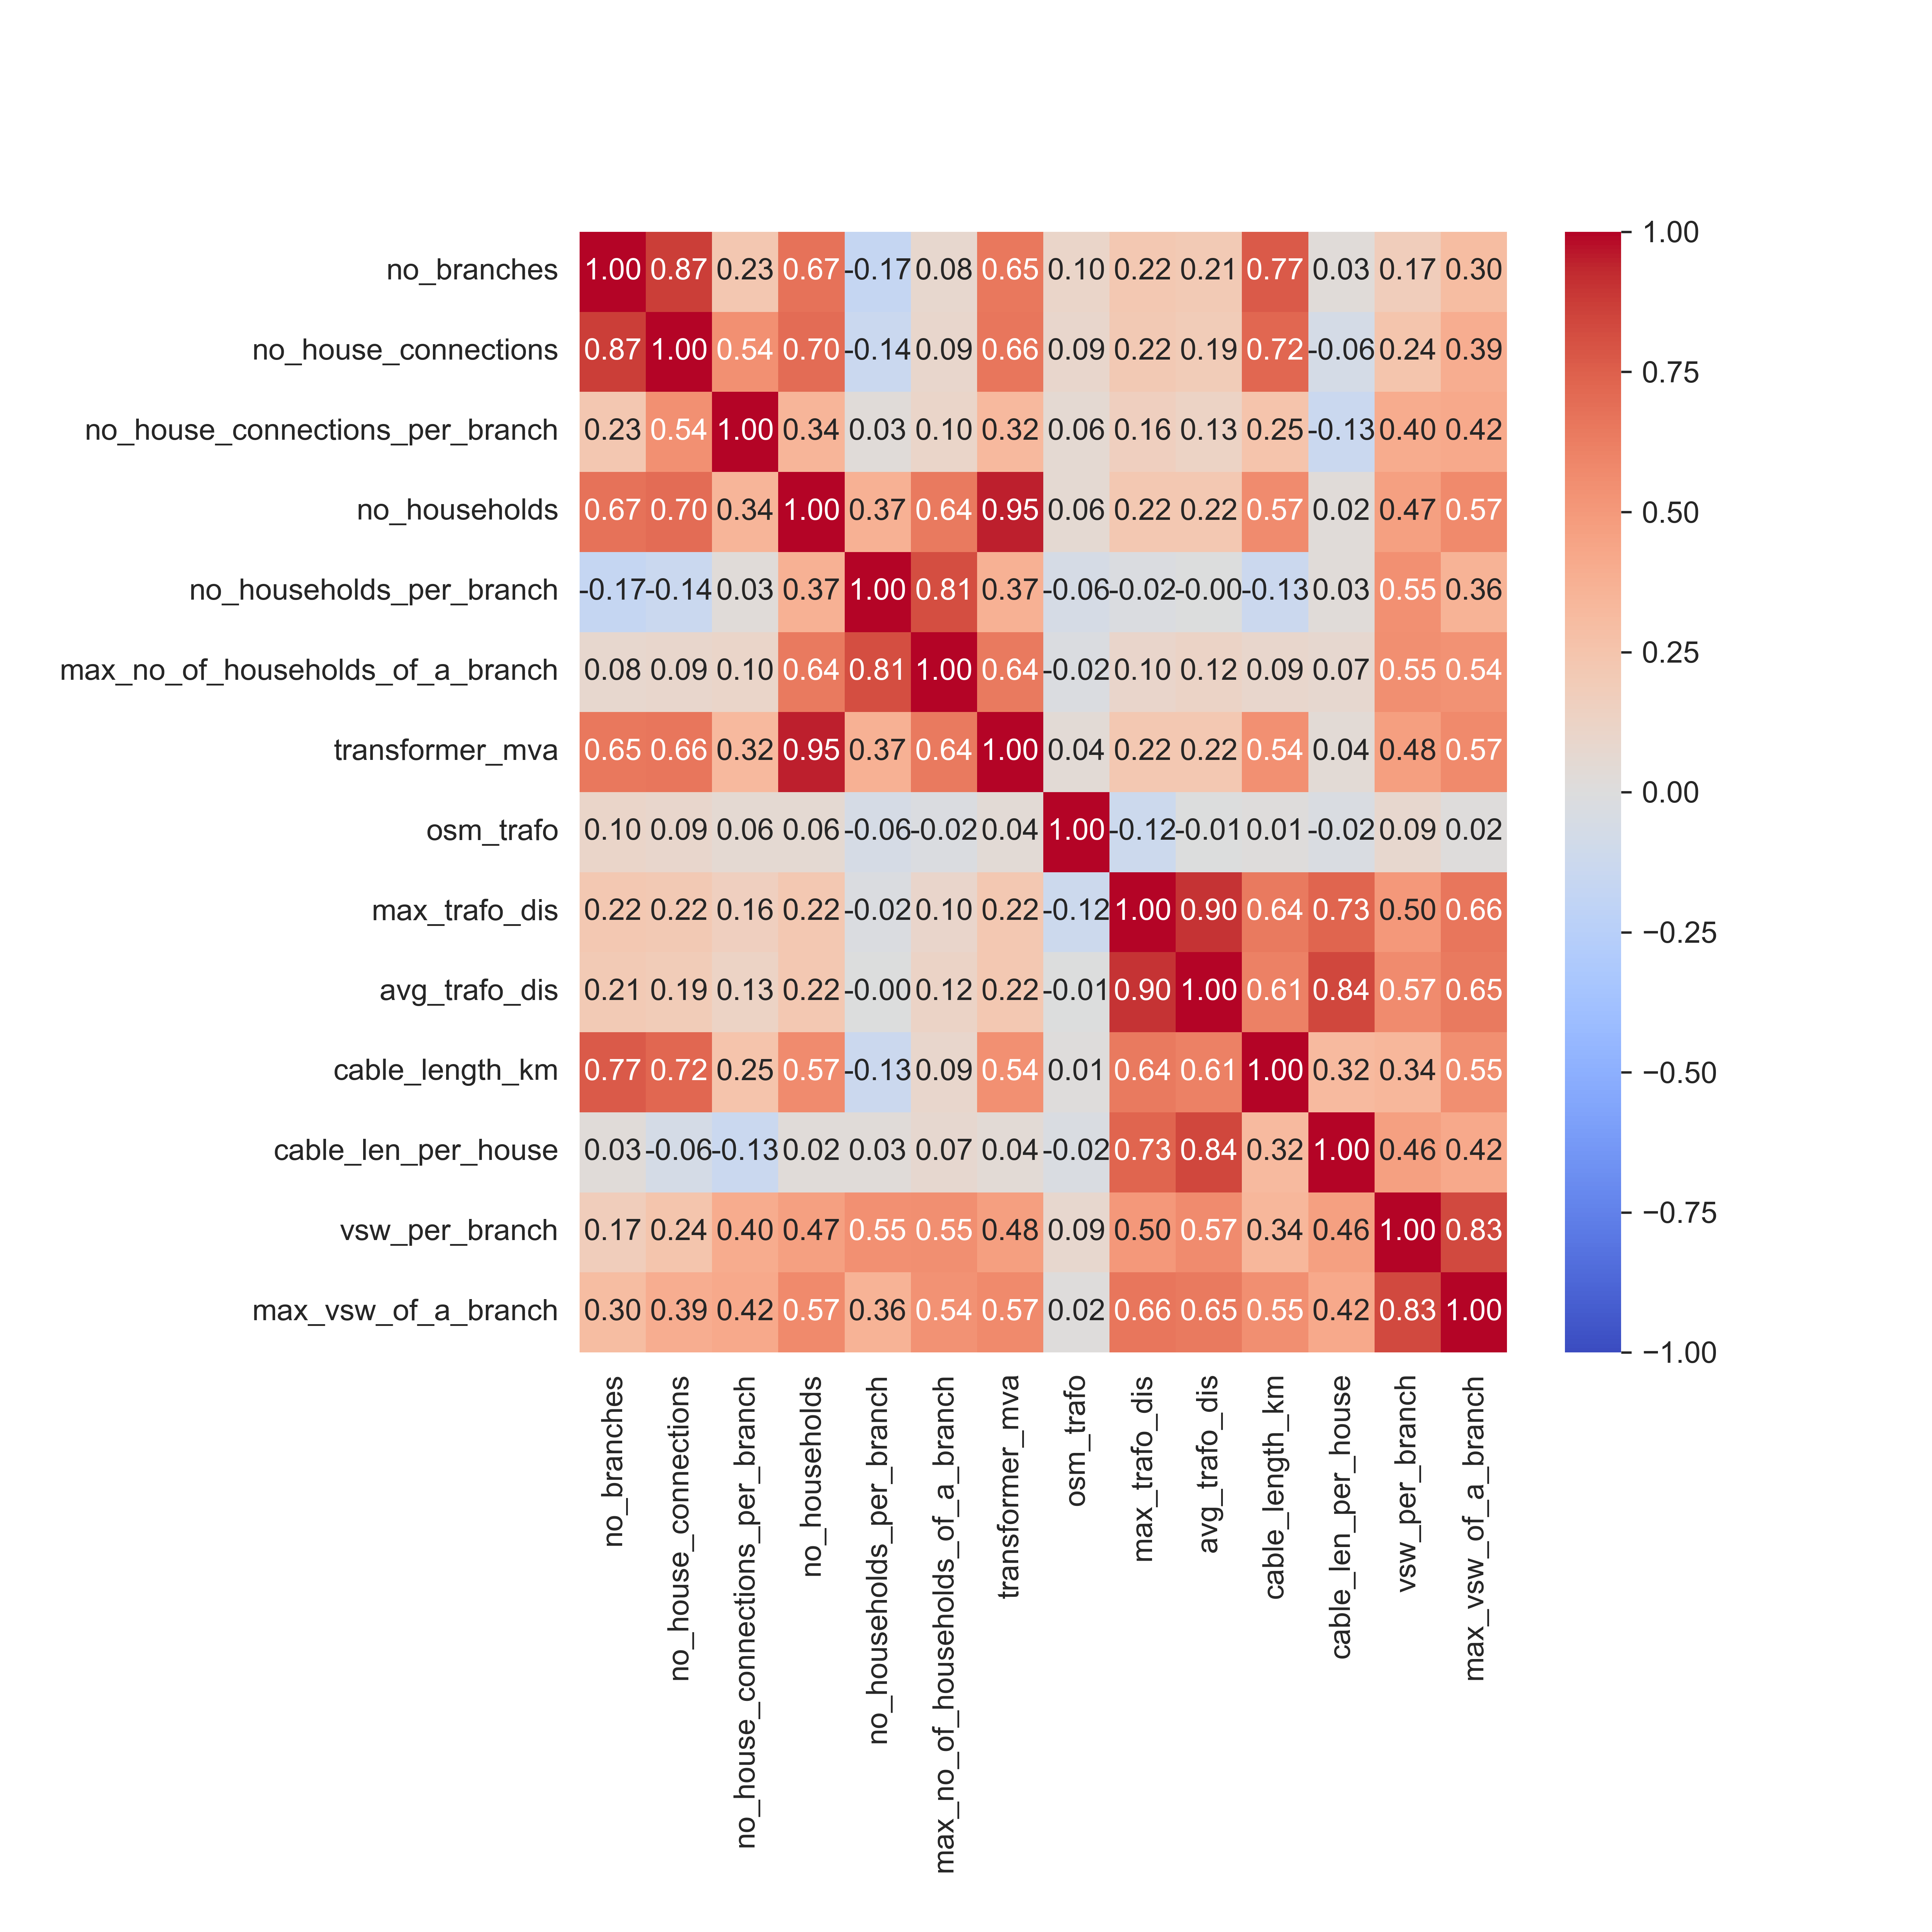
Parameter Reduction
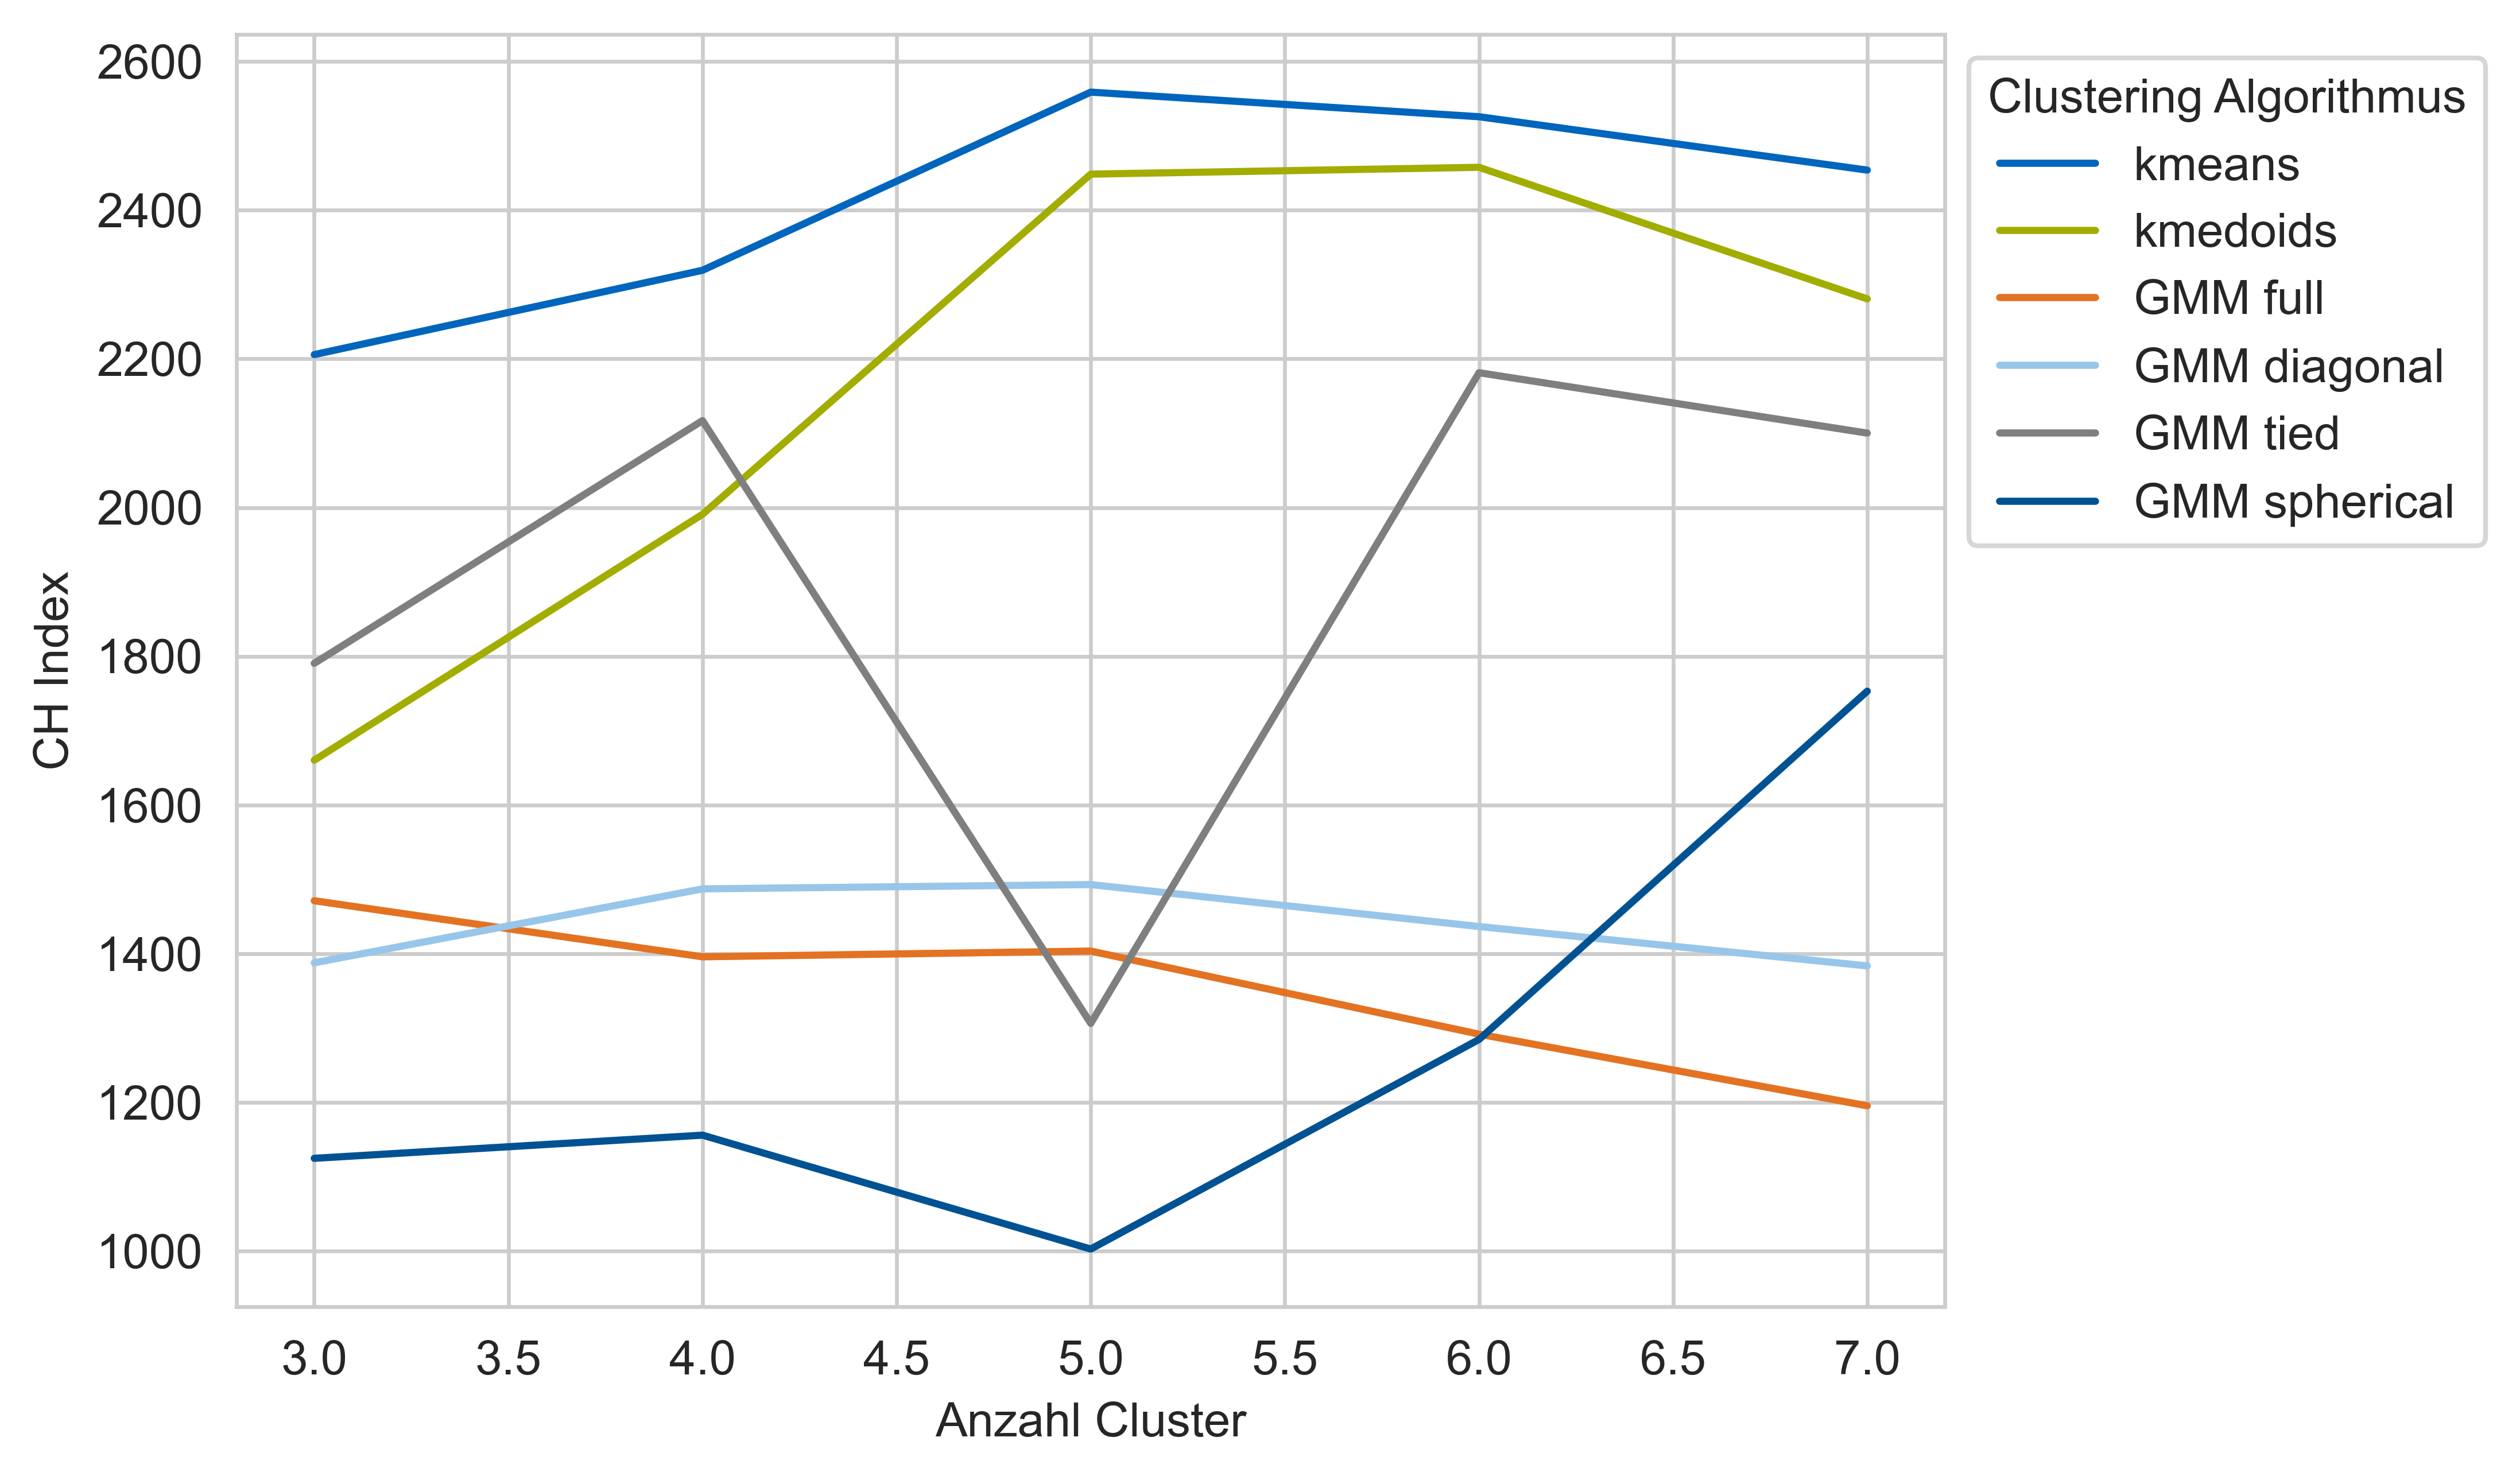
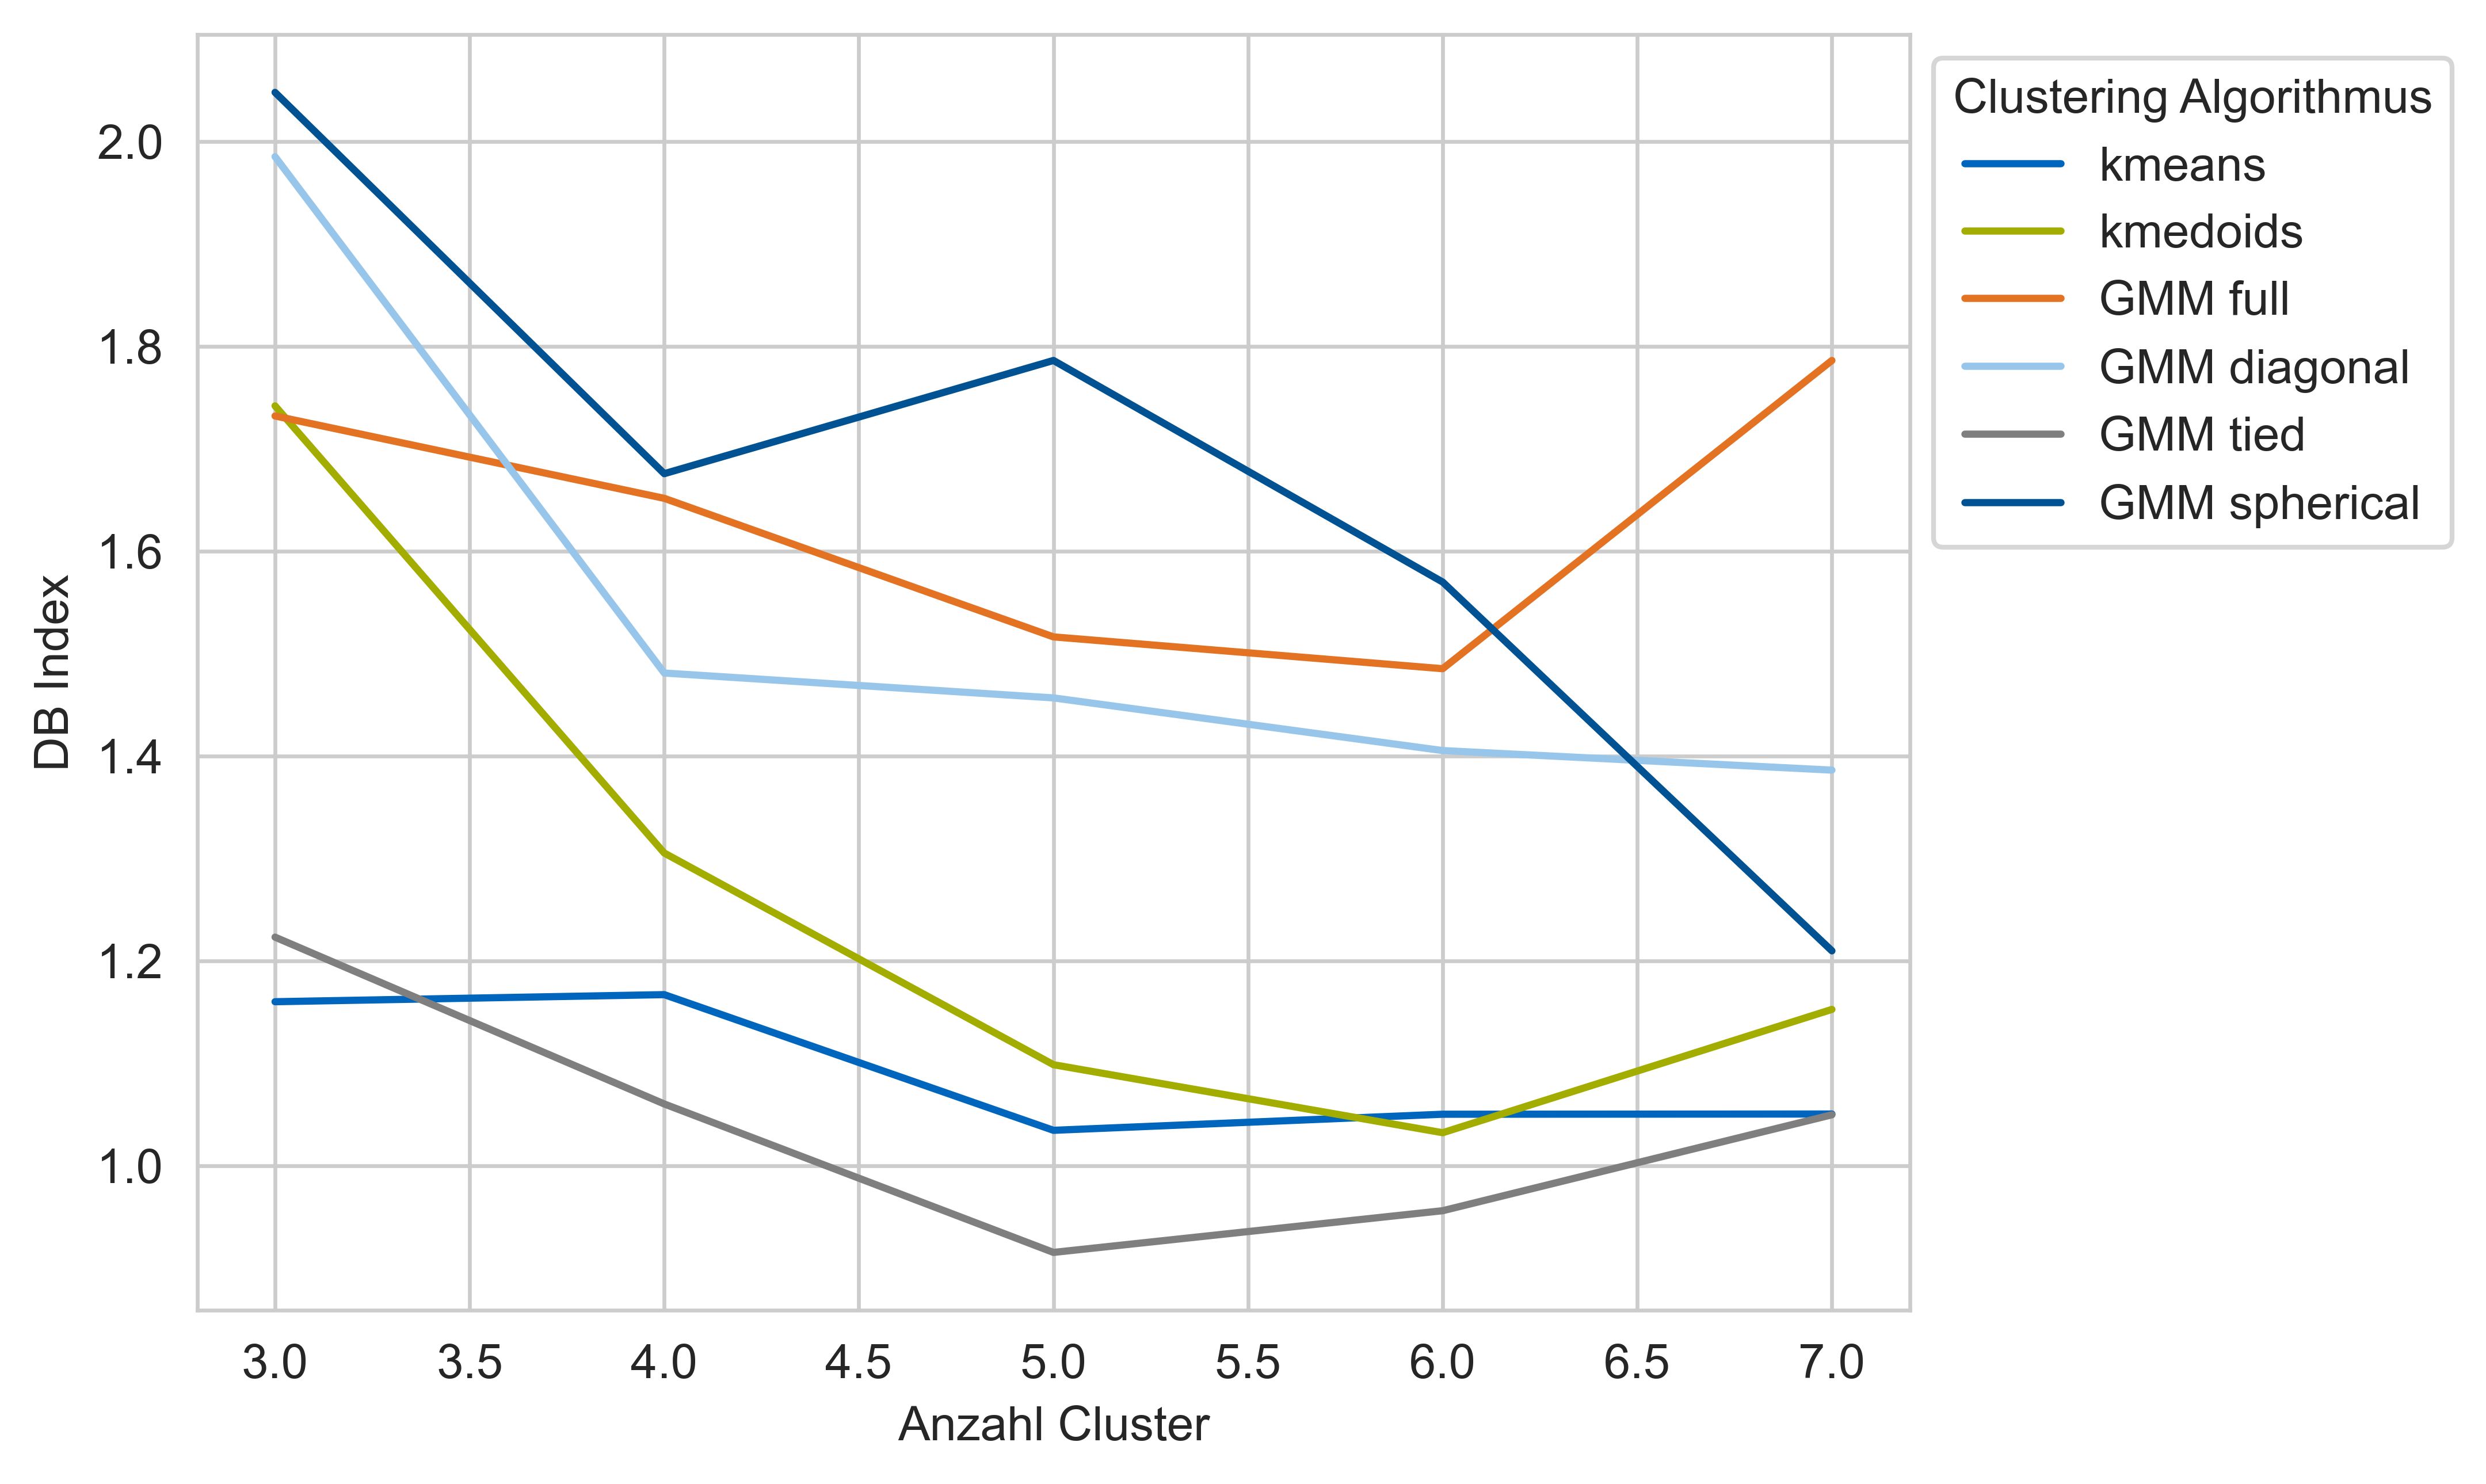
Indices
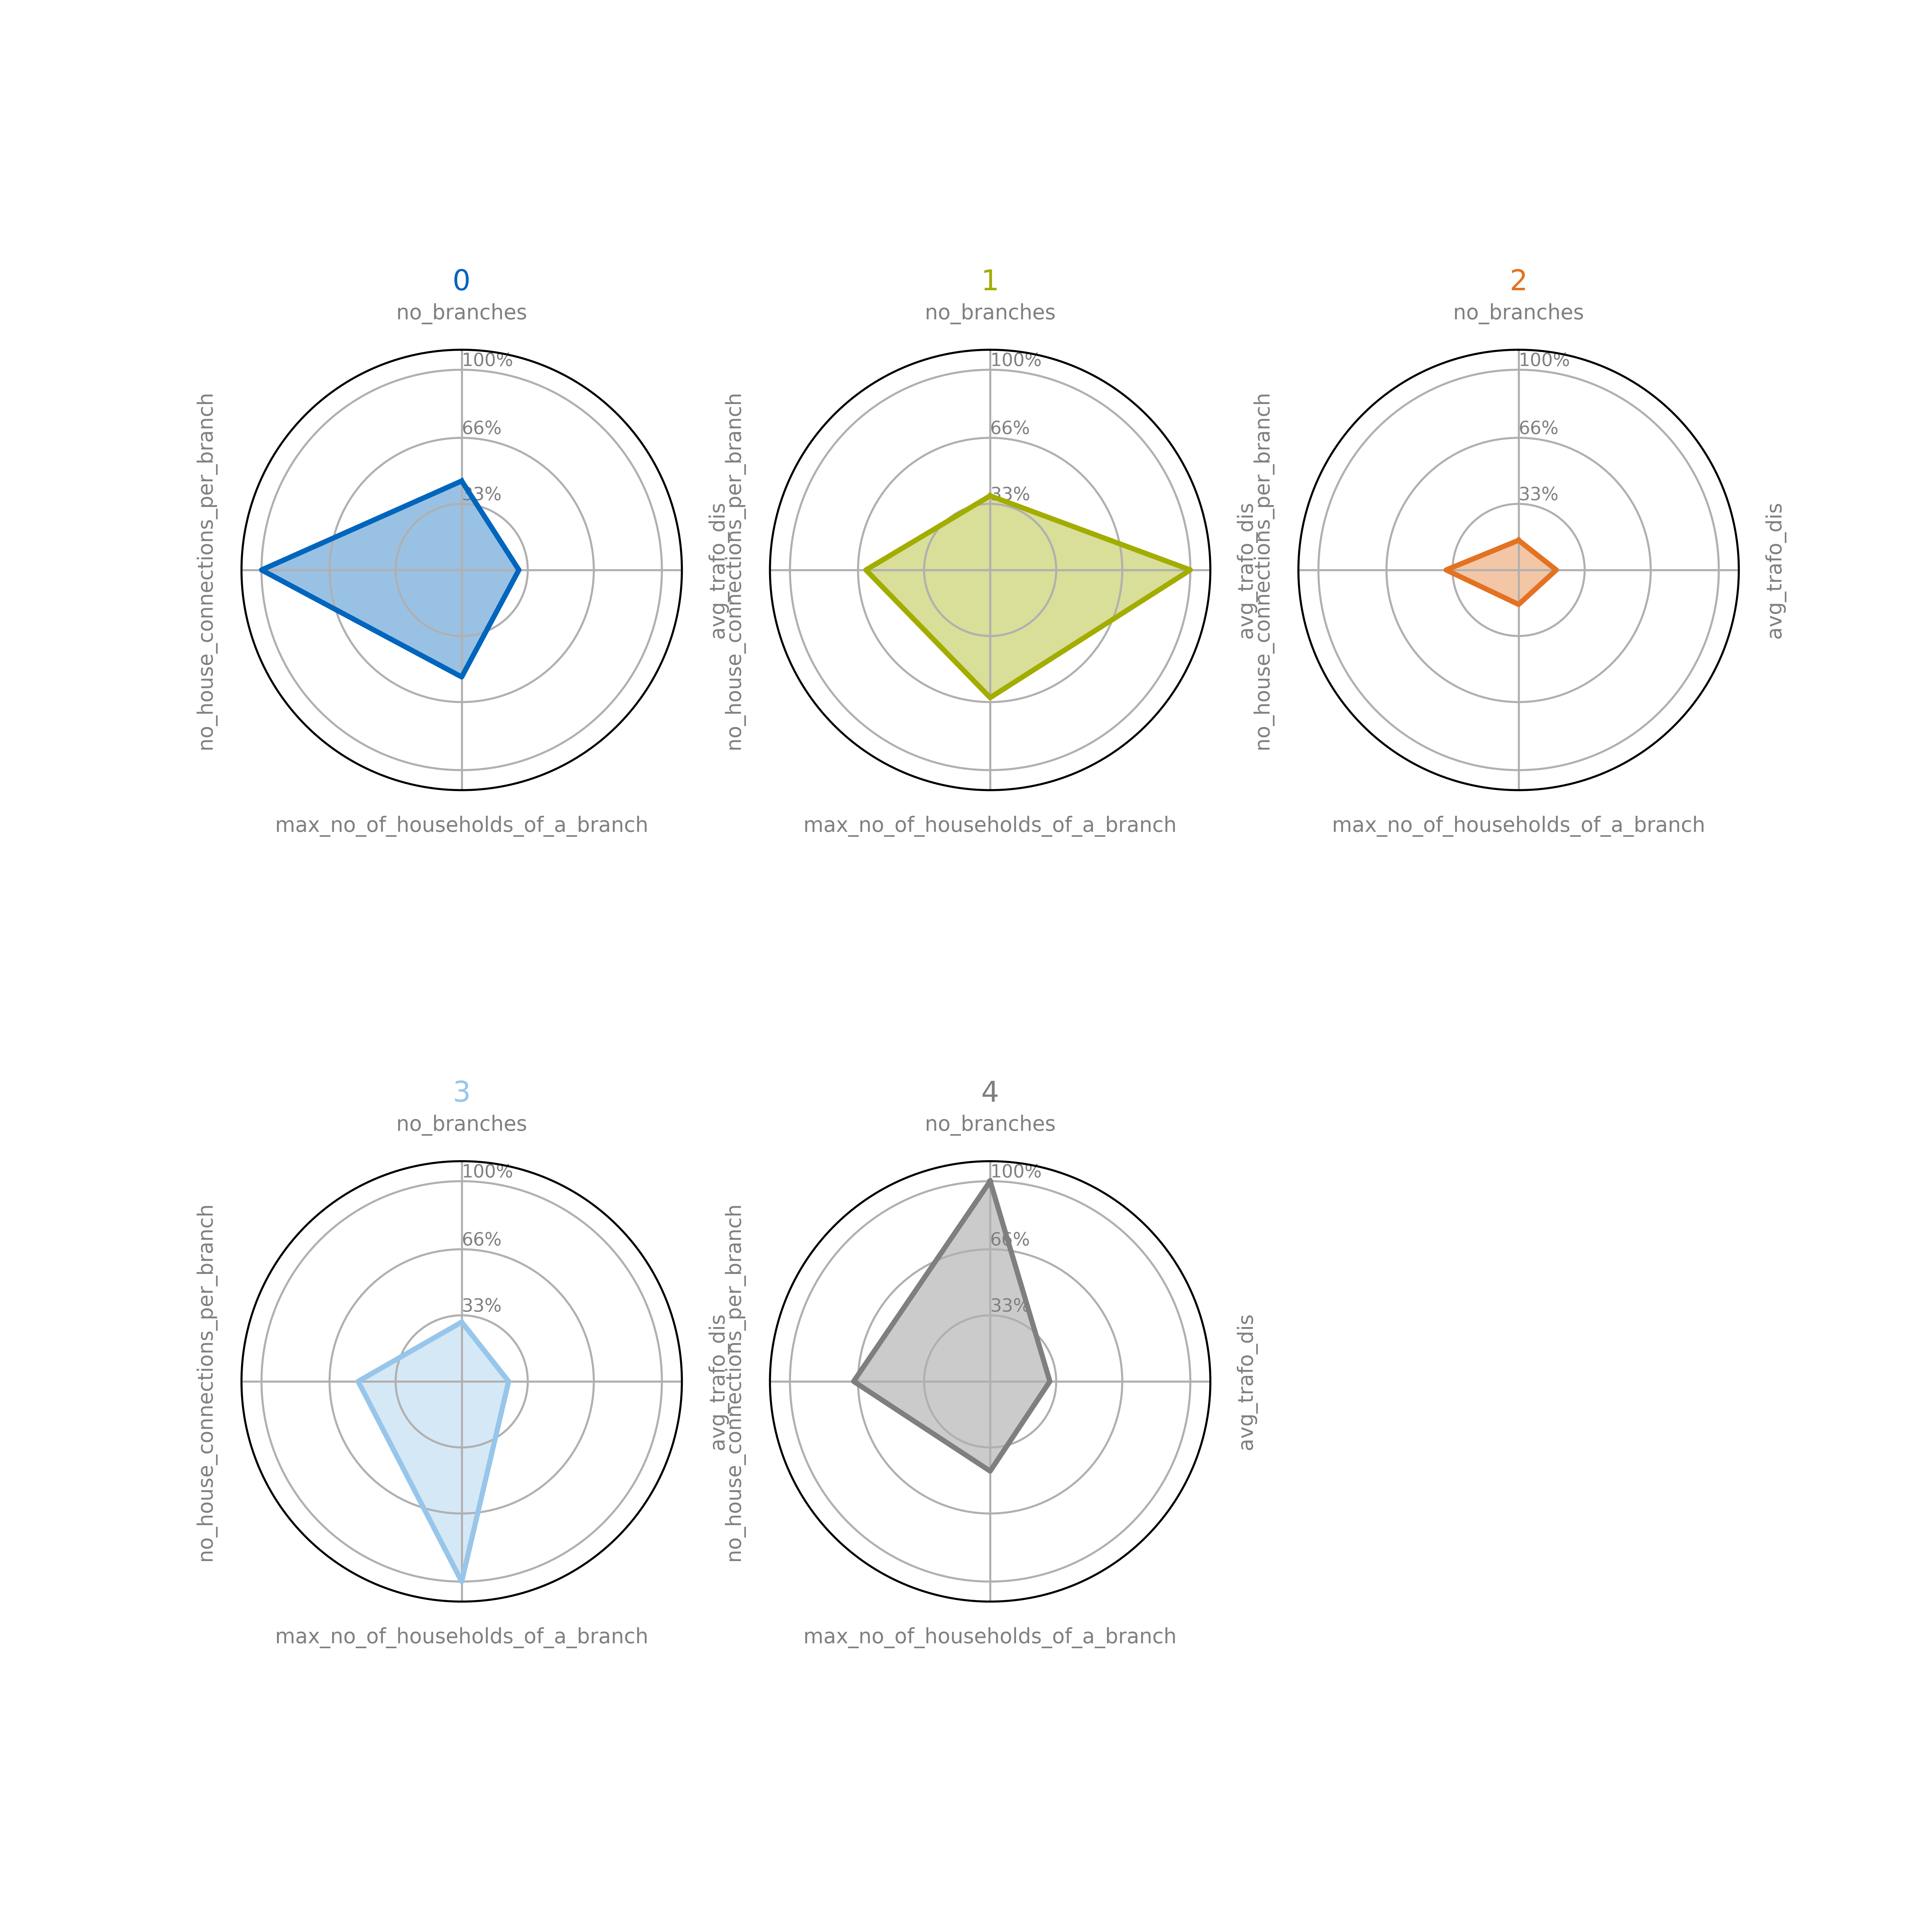
Clustering Results